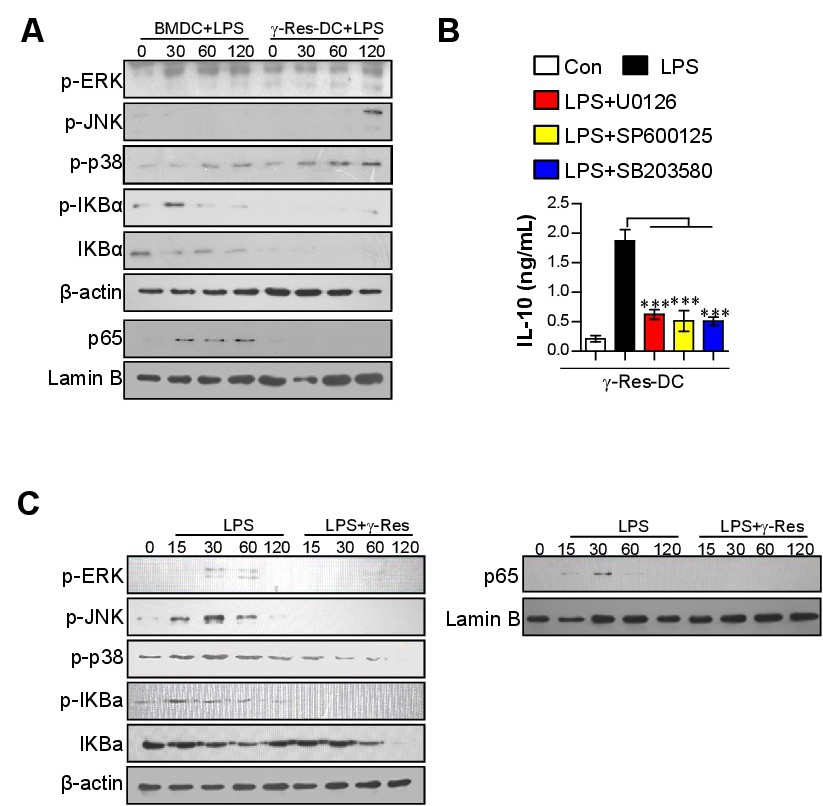
Fig. 8. Expression of MAPK and NF-κB signaling pathways in γ-Res-treated BMDCs and DCs generated by γ-Res in the presence of LPS. A) BMDCs and γ-Res-DCs were treated with LPS (100 ng/mL) for 0, 30, 60, and 120 min. Cell lysates and nuclear lysates were subjected to SDS-PAGE and immunoblot analysis using each specific Abs. B) γ-Res-DCs were treated with pharmacological inhibitors of ERK (U0126), JNK (SP600125), and p38 (SB203580) for 1 h prior to treatment with LPS for 24 h, and then, the IL-10 levels in the culture medium were analyzed by ELISA. The values shown represent the mean ± SD (n = 3 samples per group). ***p<0.001. C) BMDCs were treated with LPS (100 ng/mL) in the absence or presence of γ-Res (30 μg/mL) for 0, 15, 30, 60, and 120 min. Immunoblot analysis of the cell lysates and nuclear lysates was performed as described above. All results are representative of three independent experiments.